A QC lab I work with ran out of 2 mL clear glass HPLC vials on a Thursday afternoon with 340 samples still queued for a Friday release. The buyer had set the reorder point at 10 boxes because that “felt like a week of stock.” Actual consumption that month was 11 boxes per week, and the supplier’s quoted 5-day lead time was really 12 days door to door. The margin was negative for six days before anyone noticed. That is not a stockout problem. It is a planning problem, and it is the one this article is about: how to set analytical testing MOQ, lead time, and reorder point numbers that survive a bad week.
I have set these numbers for a chromatography consumables operation and watched them fail in ways that were entirely predictable in hindsight. The pattern is consistent. Buyers treat MOQ as a price lever and lead time as a fixed number, when both are distributions with variance, and reorder points built on point estimates are wrong roughly half the time by construction.
The naive formula is reorder point equals average daily consumption times lead time. That formula assumes lead time never moves and consumption is flat. Neither is true. A defensible reorder point has three components: expected demand during lead time, a safety stock sized to the variance in both demand and lead time, and a rounding adjustment to the pack or case multiple you actually receive.
Start with the consumption rate. Pull 13 weeks of issue data from your LIMS or inventory system, not 4. Four weeks will miss the quarter-end release spike that most regulated labs run. Compute the mean daily draw and the standard deviation. For a lab consuming 11 boxes per week of HPLC vials at a standard deviation of 2.4 boxes per week, the mean is 1.57 boxes per day and the daily standard deviation is about 0.34 boxes.
Then get the lead time distribution. Ask the supplier for their actual on-time performance over the last 12 months, not the catalog number. If they will not give it, build it yourself from receiving dates. I have seen quoted 5-day lead times with a real mean of 8 days and a standard deviation of 3.5 days once customs, allocation, and backorder events are included.
The safety stock formula that actually holds up
For independent demand with variable lead time, use:
Safety stock = Z × √(LT × σ_d² + d² × σ_LT²)
Where Z is the service factor (1.65 for 95% cycle service level, 2.33 for 99%), LT is mean lead time in days, σ_d is the standard deviation of daily demand, d is mean daily demand, and σ_LT is the standard deviation of lead time in days.
Plug in the numbers above with a 95% target and an 8-day mean lead time:
- LT × σ_d² = 8 × 0.34² = 0.925
- d² × σ_LT² = 1.57² × 3.5² = 30.2
- Sum = 31.1, square root = 5.58
- Safety stock = 1.65 × 5.58 = 9.2 boxes
Expected demand during lead time is 1.57 × 8 = 12.6 boxes. Reorder point is 12.6 + 9.2 = 21.8 boxes, rounded up to 22. The “felt like a week” number of 10 was less than half the correct figure. Note that the lead-time variance term dominates: 30.2 of the 31.1 total comes from σ_LT. If you can only fix one variable, fix lead-time variance, not demand forecasting.
What an MOQ does to carrying cost, in dollars
MOQ is the supplier’s economic batch size, not your economic order quantity. When you accept an MOQ above your EOQ, you are financing inventory the supplier would otherwise hold. The carrying cost is real and it is calculable.
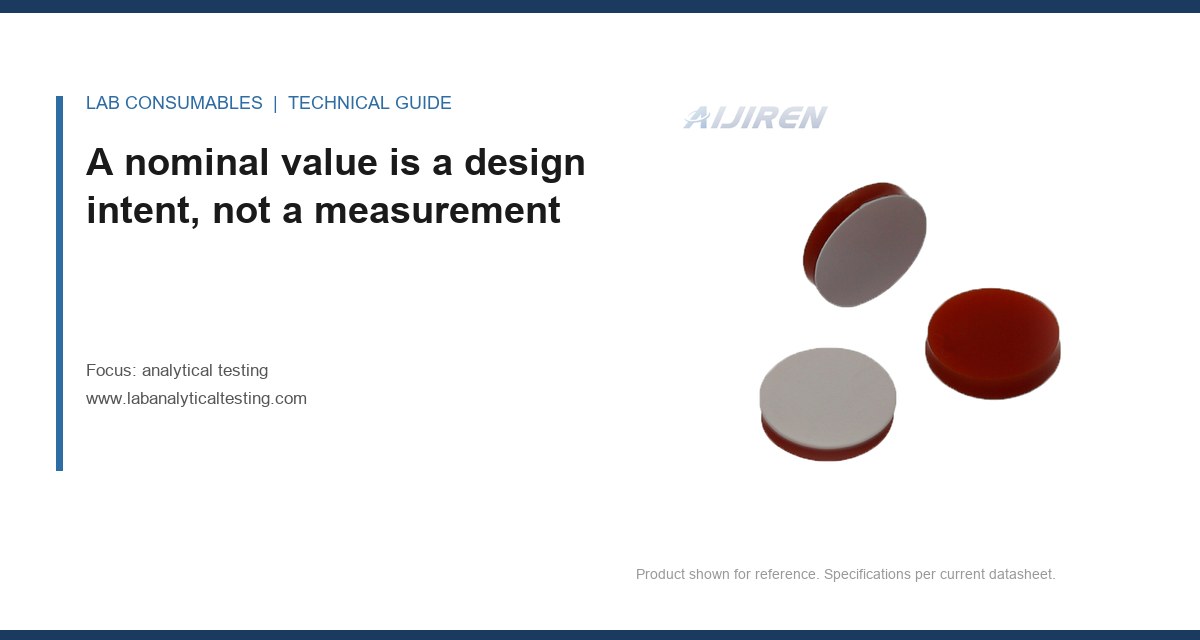
Take a common case: 2 mL clear glass vials, 11 mm crimp neck, 32 × 11.6 mm, USP Type I borosilicate, with 9 mm PTFE-lined silicone septa. Case pack is often 1,000 vials per case, and the MOQ is frequently 10 cases (10,000 vials) for a custom septa or a private-label lot. If your annual draw is 40,000 vials, an MOQ of 10,000 is 13 weeks of cover at peak. At an average unit cost of $0.18 and a carrying rate of 22% per year (capital, storage, insurance, obsolescence), the incremental carrying cost versus a 4-week order cycle works out to roughly $1,100 per year on that single SKU. Multiply by 60 SKUs and the MOQ tail is a five-figure line item nobody put in the budget.
The carrying rate itself is worth stating: 20 to 25% per year is the standard range for lab consumables. Glass is not perishable, but septa are. A PTFE-lined silicone septum has a shelf life of roughly 3 to 5 years from manufacture, and a pre-assembled cap can lose compression set if stored hot. Buying 18 months of septa to hit an MOQ is a false economy if the last six months sit in a 30 °C warehouse.
When to take the MOQ and when to walk
| Signal | Take the MOQ if | Walk if |
|---|---|---|
| Shelf life remaining | > 24 months at delivery, cool storage available | < 18 months, or no climate control |
| Annual draw vs MOQ | MOQ ≤ 13 weeks of cover | MOQ > 26 weeks of cover |
| Carrying cost vs price break | Price break > carrying cost + 5% | Price break < carrying cost |
| Method lock-in | Vial/septa qualified under your validated method | Any chance of a method change in 12 months |
| Lead-time variance | σ_LT > 3 days (MOQ buys buffer) | σ_LT < 1 day (you can order small and often) |
The method lock-in row matters more than buyers admit. Once a vial and septum combination is qualified under a validated method, changing it triggers revalidation. That makes the MOQ effectively a multi-year commitment, and it should be priced as one. If you are sourcing chromatography vials for a method that is still in development, do not sign an MOQ above 4 weeks of cover.
Lead time is a sum of stages, and only one of them is the supplier’s fault
Quoted lead time usually covers manufacturing and packing. It does not cover order processing, allocation, freight booking, customs, and receiving inspection. I break lead time into five stages and measure each:
- Order to acknowledgment: 0.5 to 3 days. Long here means the supplier is quoting before checking stock.
- Acknowledgment to ship: the quoted number, 3 to 15 days for glass.
- Ship to port of entry: 2 to 30 days depending on origin.
- Customs clearance: 1 to 10 days. Highly variable, and the biggest hidden σ_LT contributor for imported glass.
- Receiving inspection: 0.5 to 2 days. Do not skip it, but do not let it sit.
For imported borosilicate vials, the customs stage is where quoted lead times die. A 5-day manufacturing quote becomes a 14-day door-to-door reality once a container sits. That is exactly the σ_LT that blew up the safety stock calculation above. If you source from chromatography products suppliers with domestic stock, you trade unit price for a σ_LT near zero, and the reorder point math gets dramatically cheaper. Run both scenarios before you decide the domestic premium is too high.
Field case one: the septum that arrived warm
Symptom: A lab running EPA Method 8260 volatile organics saw injection-to-injection RSD climb from 2.1% to 6.8% on a mid-polarity column, with the drift appearing only on the last 20 vials of each 100-vial tray.
Measurement that identified it: The lab pulled septa from the same lot and measured compression set after 30 minutes at 60 °C. Septa from the first half of the case recovered to within 0.05 mm of original thickness; septa from the bottom of the case, which had been stored near a loading dock for six weeks, showed 0.18 mm of permanent set. The punctured septa were leaking, and the leak grew with needle count past roughly 50 punctures.
Fix: The lab moved to single-injection septa for the release run, cut the MOQ from 10 cases to 4, and added a storage-temperature clause to the purchase order. Reorder point was reset to 18 boxes with a 95% service level. The RSD came back to 2.3%.
Set the reorder point on the SKU that actually fails
Not every consumable deserves a full statistical reorder point. Some are cheap enough that a two-bin kanban is fine. Others will stop a release. Rank SKUs by the cost of a stockout, not by unit cost, and apply the formula only to the top tier.
A decision checklist for which SKUs get a calculated reorder point
- Criticality: Does a stockout stop a release or a validated method? If yes, calculate.
- Substitutability: Can another vial, column, or septum be substituted without revalidation? If yes, kanban is fine.
- Lead-time variance: Is σ_LT above 2 days? If yes, calculate and add safety stock.
- MOQ ratio: Is MOQ above 8 weeks of cover? If yes, the reorder point must account for the receipt multiple, not the raw figure.
- Consumption stability: Is the coefficient of variation (σ_d / d) above 0.3? If yes, forecast error is large and Z should be 2.33, not 1.65.
For a 9 mm screw-thread vial with a bonded pre-slit PTFE/silicone septum, the receipt multiple is often 1,000 per case. If your reorder point calculates to 4,300 units and the case pack is 1,000, you must round up to 5,000 or you will trigger an order that arrives below the reorder point. That rounding error is small per SKU and enormous across a catalog.
Field case two: the column that ran out mid-sequence
Symptom: A contract lab running USP <621> assays on a 150 × 4.6 mm, 5 µm C18 column ran out of its qualified lot on a Tuesday. The replacement lot from a different manufacturing batch gave a tailing factor of 1.4 against a method limit of 1.5, and the lab failed system suitability on three consecutive runs.
Measurement that identified it: The lab compared retention time and tailing factor across 30 injections on the old and new lots. The old lot held tailing at 1.12 ± 0.03; the new lot was 1.38 ± 0.04. The difference was real and outside the method’s system suitability window, not noise.
Fix: The lab now holds a lot-qualified buffer of 2 columns per critical method, sets reorder point at 3 columns (not 1), and requires the supplier to hold a reserved lot for 90 days. That reserved-lot agreement is the single cheapest lead-time variance reduction I know of for columns. It costs nothing at Agilent or Restek scale if you ask at order placement, and it converts a 6-week lead time into a 2-day call-off.
Reorder point is not a number you set once
Consumption drifts. A method change, a new client, or a shift in sample volume moves the mean, and the reorder point goes stale within a quarter. Recalculate monthly from a rolling 13-week window, and track two metrics: stockout events per quarter and average inventory turns. If turns fall below 4 per year on a consumable with a 12-month shelf life, you are carrying too much. If stockouts exceed one per quarter on a critical SKU, your Z is too low or your σ_LT estimate is wrong.
Watch the fill rate, not just the cycle service level. A 95% cycle service level with an MOQ of 10 cases can still mean a 70% fill rate if the one stockout happens during a release week. The number that matters to the lab manager is whether the vial is on the shelf when the run starts.
Practical parameters to write into the purchase order
These are the clauses that turn a reorder point from a spreadsheet into an operating system:
- Lead time: state the door-to-door target (e.g., ≤ 10 working days) and the on-time penalty threshold (e.g., 2 late shipments per 12 months).
- MOQ: state it in units and in weeks of your forecast cover (e.g., MOQ not to exceed 8 weeks of the trailing 13-week average).
- Reserved lot: require the supplier to hold a qualified lot for 90 days for critical columns and septa.
- Shelf life at delivery: minimum 24 months remaining for septa, 36 months for glass.
- Storage and shipping: specify 15 to 25 °C, no direct sun, and a temperature logger on any shipment over 10 days.
- Receiving inspection: state the AQL (e.g., 1.0) and the sample size, so the inspection does not become a hidden lead-time stage.
For regulated work, tie the receiving inspection to the applicable method. EPA SW-846 methods and their holding-time requirements make a late vial a data-quality event, not just a supply event. A stockout during a holding-time window can force resampling, and resampling is far more expensive than any safety stock you skipped.
Where to start on Monday
Pick the five SKUs that have stopped a release in the last 12 months. Pull 13 weeks of issue data and 12 months of receiving dates. Compute mean and standard deviation for both. Apply the formula at Z = 1.65. Compare the result to your current reorder point. I would bet on four of the five being understated by a factor of two or more, and the gap coming almost entirely from lead-time variance you never measured.
The decision rule: set reorder point at expected demand during lead time plus 1.65 × the combined demand-and-lead-time standard deviation, round up to the receipt multiple, and recalculate monthly. Treat any MOQ above 13 weeks of cover as a capital commitment and price its carrying cost at 22% per year before you sign. If a supplier cannot give you their on-time history, build it yourself, because the number you assume is the number that costs you the run. For a broader view of how these consumables fit into a testing program, the analytical testing resource library and the Thermo Fisher sample-handling documentation are both worth a read before you rewrite the PO.
References & further reading
Related resources from our lab consumables network:
- Analytical Testing at labanalyticaltesting.com
- Chromatography Vial at chromvials.com
- Hplc Vial at hplcvialfactory.com
- Chromatography Products at chromatographyforsale.com
External references and standards: