Do you Know These HPLC Terms?
2023-01-04
On a liquid chromatograph, after the sample is separated from the mobile phase through the chromatographic column, it is converted into an electrical signal by the detector and recorded by the recorder. The recorded detection signal image distributed over time is the chromatogram. On the chromatogram, the continuous curve with the component concentration change as the vertical axis and the elution time as the abscissa is called the chromatographic elution curve.
1. Related Terms of Chromatographic Elution Curve
Baseline: The curve of the response signal generated by the detector when only the mobile phase passes through the chromatographic column. A stable baseline should be a nearly horizontal straight line reflecting the noise level of the detector system over time.
(1) Baseline drift: The slow change of the baseline orientation over time.
(2) Baseline noise: Baseline fluctuations due to various reasons.
Chromatographic peak: The differential curve of the response signal generated when the effluent components of the chromatographic column pass through the detector system.
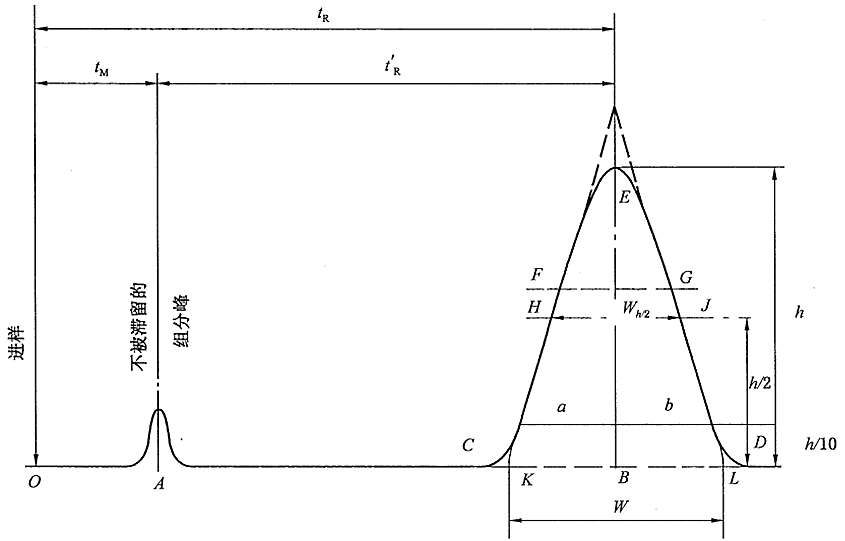
(1) Standard deviation (σ): When the chromatographic peak is normally distributed, half of the peak width distance at 0.607 times the peak height, half of the EF in the figure.
(2) Peak height (h): the vertical distance between the chromatographic peak apex and the baseline, h in Figure 1-10.
(3) Peak width (W): Draw a tangent line at the inflection point of the outflow curve and intersect the distance between two points on the baseline. Equal to 4σ, CD in the figure.
(4) Peak height at half height (Wh/2): A straight line parallel to the bottom of the peak is drawn through the midpoint of the peak height, and the distance between this straight line and the two sides of the peak intersects, as shown in HJ in the figure.
(5) Peak area (A): the area between the peak and the baseline.
Retention value: The retention value is the value of each component in the sample, that is, the retention value of the solute in the chromatographic column, which is determined by the thermodynamic factors in the chromatographic separation process.
(1)Dead time (tm): the time from the injection of the substance that does not interact with the stationary phase to the peak maximum value, tm in the figure. It is directly proportional to the void volume of the column. Since the substance does not interact with the stationary phase, its flow rate is similar to that of the mobile phase, so the average flow rate of the mobile phase can be calculated according to tm.
(2) Retention time (tR): the time from sample injection to peak value, tR in the figure.
(3) Adjusted retention time (t’R): the retention time of a component after deducting the dead time, which is the retention time of the component in the stationary phase.
The retention time tR includes the time tm that the component passes through the column with the mobile phase and the time t’R that the component stays in the stationary phase.
(4) Dead volume (Vm): the sum of the gaps between the stationary phase particles in the chromatographic column tube, the gap between the chromatographic pipeline and the connector, and the detector gap. When the latter two items are neglected, the dead volume can be calculated by the product of the dead time and the average volume flow rate of the mobile phase (mL·min-1).
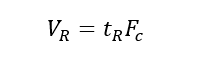
(5) Retention volume (VR): the volume of the mobile phase that passes from the injection to the maximum concentration of the component after the column, that is, the volume of the mobile phase that flows through the chromatographic column within the retention time.
2. Partition Coefficient
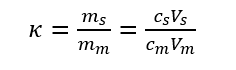
The partition coefficient refers to the ratio of the concentration of a component in the stationary phase to the concentration in the mobile phase at a certain temperature and in an equilibrium state, expressed by the symbol K.
The partition coefficient reflects the migration ability and separation efficiency of a solute in two phases and is an important physical and chemical characteristic parameter describing the behavior of a substance in two phases.
3. Capacity factor
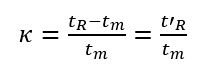
Capacity factor refers to the mass ratio distributed in the stationary phase and the mobile phase when the components are distributed in the two phases to reach equilibrium at a certain temperature and pressure. The capacity factor reflects the migration rate of the components in the column. Also known as the partition ratio, represented by the symbol κ.
The difference between the capacity factor and the partition coefficient is that K depends on the properties and temperature of components, mobile phase and stationary phase, but has nothing to do with volume Vs and Vm; k is not only related to properties and temperature but also related to Vs and Vm. Since t’R and tm are easier to measure than Vs and Vm, the capacity factor is more widely used than the partition coefficient.
4. Selectivity Factor
The selectivity factor, also known as the relative retention value, refers to the ratio of the distribution coefficient or capacity factor of two different components, and the ratio of the adjusted retention time, expressed by the symbol α.
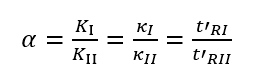
α is related to the distribution properties of the compound in the stationary phase and mobile phase, and the column temperature, and has nothing to do with the column size, flow rate, and packing conditions. Essentially, the size of α represents the difference in the thermodynamic properties of the equilibrium distribution of the two components between the two phases, that is, the difference in the intermolecular interaction force. The larger the α, the better the column selectivity and the better the separation effect.
5. Resolution
Resolution is an index to measure the separation effect of the chromatographic column. It indicates the separation of adjacent component chromatographic peaks, specifically the difference between the adjacent component chromatographic peak retention values tRI, tRII and the average width of the two peak widths WI and WII. The ratio is represented by the symbol R. (Note: The denominator symbol of the following formula is wrong, it should be “+”)
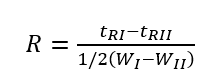
The larger the distance between the two peaks, the narrower the two peaks, the larger the R-value, and the better the separation. When R=1, the two chromatographic peaks overlap by about 4%, which can be called basic separation; when R=1.5, the two chromatographic peaks overlap by about 0.3%, which can be regarded as complete separation of two adjacent components.
Next News:
Back to List
Laster News
-
 下午4:09Weighing the Pros and Cons of PTFE/Silicone Septa
 -
 下午4:05Decoding Vial Discard Guidelines: Ensuring Precision in Chromatography
 -
 下午5:01Navigating Micro Inserts for HPLC Vials: A Comprehensive Guide
 -
.jpg) 下午2:02Common faults and solutions of automatic samplers(2)
下午2:02Common faults and solutions of automatic samplers(2) -
 下午5:08Ensuring Sample Integrity: Navigating EPA Storage Vials Stability Guidelines